Color palete / color visualization

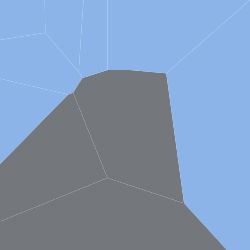
Abstract of half dome

Random generation
The first step in making your own diagram is selecting a size and if you would like to start with random points on the canvas. These prompts can be found immediately on the vertex paint page and canvas measurements must be between 10 to 5000 pixels. For initial exploration of the project I recommend a canvas with a width of 750 and height of 500 with ~60 initial points.
Once the graph is generated options for editing it directly will apear to the side and below the canvas. To the right of the graph you will find tools to add points to the graph. Firstly manual input for points that allows precision placement which is useful for advanced drawing techniques, next is the color selector for new regions of the graph and finally the add point button which adds the point to the graph. The graph is also interactive and can be clicked on to automatically add coordinates to the input fields.
Below the graph more options can be found. These include regenerating the graph with new parameters, selecting the width of cell borders and downloading a copy of the graph. Under this table a list of the points that make up the current graph with the option to delete them if desired.
Vertex paint as a whole is fundamentally an implementation of Fortune’s algorithm. This algorithm takes advantage of the ability to represent parabolas as a focal point and a directrix. The parabola is represented by the curve that is equidistant from both the focal point and a line along the same plane. This is advantageous to us because a Voronoi cell is defined by equidistance between one seed point and another. However, for this problem we have many focal points in fact one for each seed point. Therefore, we will need a composite line of parabolas which Fortune termed the beach line. To set up the algorithm we order all seed points and allow our sweep line (functionally directrix) to move across them. As the sweep line moves the beach line will progress closer to the expected Voronoi cells by adding arcs and deleting them. Because the algorithm fundamentally only performs two actions on the beach line it can be represented by an event queue where events add and subtract arcs. Fortune called these events point events and circle events respectively. Once the event queue is clear and edge cases have been resolved the diagram is created. I recommend this article by Jacques Heunis for wrapping your head around the finer details of this algorithm as it helped me a lot in this implementation.
The next step in getting Vertex Paint is rendering the results. This is done on the html canvas element by sorting the list of points that make up the Voronoi diagram by cell, next ordering them clockwise per cell and drawing the cell to be colored. That is a lot of Javascript to be glossed over but I find it less interesting than the algorithm itself. The final step was trying to add intuitive tools for editing the diagram. I would still like to take a look at reworking these to be smoother but I feel they serve the functions needed to create these diagrams.
Firstly, I would like to address some major bugs that I have noticed while using the site. There is a bug causing a failure to generate that seems to happen more frequently with increased point density. Additionally, there is a bug that causes cells to become malformed when nearby points have an identical y axis. Outside of bug fixes, there are many changes and features I would enjoy adding to Vertex Paint in the future. I plan on first reworking the input system in order to allow adding points in one click, editing of existing points and increased graph responsiveness like live updates on mouse drag. Next I would like to add the ability for users to upload their own images for editing. This would consist of their image overlapping the canvas with some transparency allowing the user to place points over it with corresponding colors. The final product being an image with a customisable stained glass effect. Changes like these may eventually require a user authentication system as well as a backend database. Overall, I am excited to tackle these challenges one at a time.

Color palete / color visualization

Abstract of half dome

Random generation